
Office Space Utilization

The British Council for Offices has replaced the long-used 80% office utilisation assumption with a post-pandemic UK benchmark of about 66%, implying effective density closer to 15 m² per occupant rather than 12.5 m² (BCO analysis). That change matters, but the weekly pattern matters more. Demand is concentrated from Tuesday to Thursday, while Monday and Friday operations often serve a much smaller population. A London office can therefore feel constrained at midweek and wastefully empty at the edges of the week without changing its floor area at all.
For facilities managers, office space utilization isn't just a property metric. It determines when reception needs reinforcement, when security presence is most visible, how cleaning teams should be deployed, and which floors need heating, cooling, lighting, and routine servicing. The practical challenge is to reduce waste without making employees feel that every comfort has been stripped out.
Table of Contents
The New Reality of Office Space Utilisation in London - Why the five-day model no longer works
Key Metrics to Measure Utilisation - Peak demand deserves its own measure
How to Measure Office Space Utilisation Accurately - Compare the tools before buying more technology - Build a measurement layer, not a surveillance culture
Turning Utilisation Data into Cost Savings and Safety Improvements - Savings must not remove resilience
Best Practices for Optimising Office Space Utilisation - Four practical moves - Protect the employee experience
How Integrated Facilities Management Supports Higher Utilisation - What coordinated service looks like on the ground - Test whether your FM model supports utilisation
The London Market Reality and What It Means for Your Strategy
The New Reality of Office Space Utilisation in London
Post-pandemic UK office utilisation has stabilised at about 66%, below the former 80% benchmark, according to the BCO's 2025 analysis (British Council for Offices). Its planning implication is effective density of 15 m² per occupant, rather than 12.5 m². For London operators, this means a building planned around historic attendance may provide more capacity than employees now use.
The headline figure does not describe a steady daily pattern. Tuesday-to-Thursday occupancy averaged 40%, while the average across all weekdays was 30%, based on the same analysis. Attendance is concentrated around collaboration, team meetings, and employer expectations, producing sharp mid-week peaks and quieter Mondays and Fridays.
That uneven demand changes how the building must run. On Wednesday morning, lifts, turnstiles, meeting rooms, washrooms, coffee points, and reception queues can all face pressure. By Friday, desks may be widely available while routine service demand falls. A fixed five-day staffing model either leaves peak periods under-supported or pays for capacity that quiet days do not need.
Why the five-day model no longer works
Earlier BCO research, published in 2018, recorded average workplace density of 9.6 m², compared with 9.9 m² in 2013, indicating that offices were already becoming slightly denser before the pandemic (BCO occupancy and density research). The research covered 132 buildings, 84 occupiers, 314 floors, and 6.6 million sq ft. Average utilisation often ranged from 40% to 60%, with midweek peaks of 33%.
The operational response is not to maximise desk occupancy. Facilities teams need to separate capacity, attendance, and service demand. A floor can have enough desks overall but too few suitable meeting rooms on its busiest day. A building can show low average occupancy yet still require visible security and reception cover when visitor traffic is concentrated.
Cleaning, reception, security, heating, cooling, lighting, and routine maintenance should follow these attendance patterns. Scale scheduled activity and staffing up for the busiest credible window, then reduce routine deployment as demand falls. A weekly average should inform the plan, not dictate every shift.
Key Metrics to Measure Utilisation
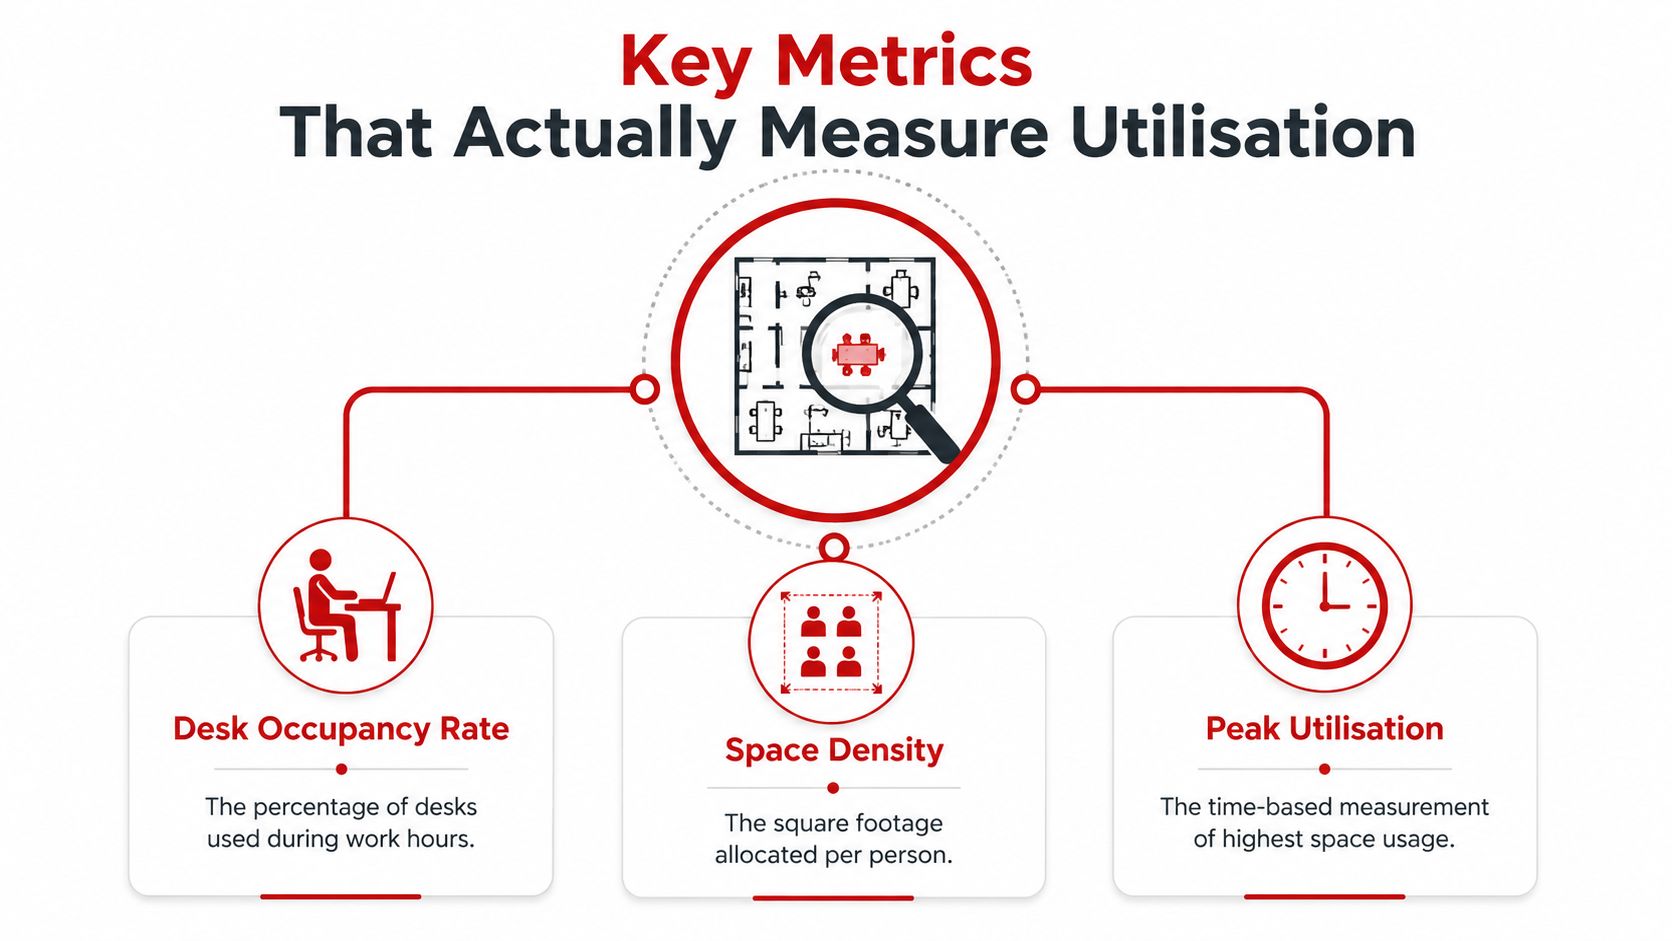
“Utilisation” needs a defined method before it can guide a lease, layout, or staffing decision. Facilities teams should separate occupancy rate, utilisation rate, density, and peak utilisation, because each measures a different operational question.
Occupancy rate is a point-in-time measure. It records how many desks, rooms, or seats are in use compared with the spaces available at that moment. If 80 desks are occupied and 200 are available, that observation records 40% occupancy. The figure shows immediate demand, but not whether those desks were used briefly or for most of the working day.
Utilisation rate measures use over a defined period. It can show how often a meeting room is occupied during available hours, or how consistently a floor is used across the week. A room may be busy on Wednesday afternoon yet lightly used across its full operating period. Booking data indicates stated demand, but it does not prove that a person arrived or that a room was used.
Density describes floor space allocated per occupant. The BCO planning reference of 15 m² per occupant offers a UK benchmark for considering effective density. The separate BCO study recorded 9.6 m² workplace density in its 2018 report, which shows why the definition, area measured, and occupancy basis must be stated clearly. Density alone cannot confirm that a workplace supports focused work, collaboration, storage, accessibility, or safe movement.
Peak demand deserves its own measure
Average utilisation supports portfolio planning. Peak utilisation protects the daily operation. Record the highest simultaneous use of desks, rooms, circulation areas, reception, washrooms, and shared amenities, then compare it with practical capacity rather than a theoretical maximum.
A useful dashboard should separate:
Desk demand: Occupied desks by floor, zone, weekday, and time block.
Room demand: Booked rooms compared with observed use, including cancellations and no-shows.
Attendance pattern: Building entries by weekday and time block.
Density: Occupants relative to usable floor area.
Service pressure: Queues, incidents, cleaning complaints, temperature problems, and reception workload during busy periods.
The operating context matters. Low room utilisation may reflect poor allocation rather than surplus space. A high desk figure may come from an event or an imbalanced floor plan. Mid-week peaks also affect security, cleaning, reception, and other soft services in facilities management. Staffing and scheduled work should follow measured demand, while quieter days receive an appropriate, not identical, level of cover.
How to Measure Office Space Utilisation Accurately
No single data source captures the whole workplace. Access control shows who entered the building, not where they worked. Booking platforms record intended use, not attendance. Sensors provide more direct evidence, but require suitable placement, maintenance, and clear privacy controls.
A reliable measurement approach combines sources according to the decision required. Use entry data for building-level attendance patterns, desk and room sensors to test actual use, and booking records to examine demand and allocation. Manual observation remains useful during a baseline exercise or where technology coverage is incomplete. It should validate the system, not become the only permanent method.
Compare the tools before buying more technology
Method | What It Measures | Limitations | Best For |
|---|---|---|---|
Occupancy sensors | Presence at desks, in rooms, or within defined zones | Coverage gaps, calibration issues, maintenance, and privacy considerations | Real-time availability and granular space analysis |
Desk and room booking systems | Reservations, booking times, user demand, and allocation patterns | Bookings may not reflect actual attendance or room use | Managing shared desks and rooms |
Access control and footfall data | Entries, exits, and broad building attendance trends | Doesn't confirm where occupants work or how long they stay | Building-level occupancy patterns and security planning |
CCTV-based analytics | Movement and occupancy patterns without necessarily identifying individuals | Requires clear governance, suitable camera positioning, and careful communication | Circulation analysis, entrance flows, and zone-level trends |
Manual counts and observation | Actual visible use during selected periods | Labour-intensive, subjective, and limited to sampled times | Initial baselines, validation, and investigating anomalies |
Build a measurement layer, not a surveillance culture
Privacy concerns can weaken an otherwise sound project. Explain the purpose of collection, limit data to the operational question, and keep building utilisation reporting separate from individual performance management. A room sensor showing whether a space is occupied has a different operational and privacy impact from a system identifying an employee's movements.
Start with the decision. For Wednesday desk pressure, measure desk use by floor, zone, and time block. For an empty large meeting room beside overbooked small rooms, compare room size, booking intent, cancellations, no-shows, and observed presence. For security planning, entry flows and incident logs may provide better evidence than desk sensors.
Good measurement is proportionate. Collect enough information to make a decision, then stop collecting what that decision does not require.
Review results across the full working week, not just the busiest day. Remit Consulting's independent UK monitoring found average office occupancy of about 37% across the week, with Tuesdays to Thursdays around 45%, Mondays about 30%, and Fridays around 20% (written evidence submitted to Parliament). The pattern shows why a Tuesday-only survey can misrepresent building demand and lead to poorly timed staffing, cleaning, reception, or security cover.
Turning Utilisation Data into Cost Savings and Safety Improvements
A Wednesday peak can expose a flaw in a Monday-to-Friday operating model. If desk and entry records show that attendance concentrates in the middle of the week, the facilities manager can adjust cleaning, reception, security, HVAC, and lighting around that pattern. The aim is not to run a building on a reduced service every day. It is to match planned activity to actual demand while keeping safety and occupant experience intact.
The first practical gain usually comes from service scheduling. Lower-attendance days may suit periodic tasks, planned maintenance, or reduced response coverage, while busy periods need more visible support. Cleaning, security patrols, and building controls should follow the building's operating profile rather than a fixed five-day assumption.
A workable adjustment might include:
Cleaning: Place daytime response teams and washroom checks where attendance is highest, while maintaining hygiene standards and required routines throughout the building.
Security: Increase visible coverage at entrances, lifts, and shared areas during busy arrival and departure periods. Retain access control, monitoring, and escalation arrangements on quieter days.
HVAC and lighting: Apply floor or zone schedules where systems permit, with safeguards for occupied areas, sensitive equipment, and late-working teams.
Reception: Match front-of-house staffing to visitor appointments, tenant arrivals, deliveries, and events instead of assuming steady daily footfall.

Savings must not remove resilience
A lower-cost rota can create unacceptable exposure. Low general attendance does not remove the need to support laboratories, critical operations, vulnerable occupants, high-value assets, or people working outside standard hours. Security and life-safety obligations set the floor for any variable-cost decision.
Occupancy information also supports fire safety planning. It can help teams estimate likely evacuation loads, identify when shared areas become congested, test muster arrangements, and confirm that access records remain useful during an incident. These inputs should support the building's fire risk assessment, emergency procedures, and competent advice, not replace them.
The same evidence helps finance teams assess a lease, consolidation option, or service change. Underused space is not automatically space to remove. Review whether demand is persistently low, which areas are constrained during midweek peaks, and whether service adjustments can improve the existing footprint before a costly move.
For a practical review of the facilities implications, reducing operational costs through FM decisions offers a useful starting point. A credible business case should show financial impact alongside employee experience, security visibility, hygiene, comfort, and safe capacity.
Best Practices for Optimising Office Space Utilisation
Optimisation works when it starts with operating behaviour, not furniture. Before removing desks or closing a floor, establish which days create pressure, which teams need to work together, and which spaces employees choose. Then make changes that improve availability without forcing people into an office that no longer supports their work.
Four practical moves
Introduce shared desks carefully. Hot-desking can reduce dormant assigned capacity, but a bare desk ratio isn't a workplace strategy. Give employees reliable booking rules, clear release procedures, suitable equipment, lockers where needed, and a dependable cleaning standard. Keep dedicated areas for teams whose work requires continuity, sensitive material, or frequent collaboration.
Zone the floor around real tasks. Create a mix of focus, collaboration, social, and support areas. A floor full of identical desks may look efficient on a plan but perform poorly when people need quiet calls, confidential conversations, or group work. Use observed demand to adjust the balance rather than copying a standard workplace template.
Use booking software as a coordination tool. Desk and room booking platforms work best when they show availability clearly, release unused reservations, and provide reporting that facilities teams can act on. They work poorly when employees must book every minor activity, when no-show rules are unclear, or when the system becomes a proxy for monitoring individuals.
Review the pattern routinely. Compare weekday, time-of-day, floor, and space-type data. Investigate exceptions before making capital decisions. A room that appears underused may have poor acoustics, unsuitable furniture, an inconvenient location, or a booking policy that pushes users elsewhere.
Protect the employee experience
Over-optimisation creates its own failure. If every available desk is allocated for the busiest forecast, employees lose choice and teams have no buffer for visitors, project work, delayed meetings, or unexpected attendance. A well-run workplace leaves practical flexibility and makes the peak day feel organised rather than rationed.
Communication matters as much as the layout. Explain why changes are being made, publish the rules in plain English, and ask employees where the current arrangement fails. Monitor complaints alongside utilisation figures. Employees may report a high-quality office as “full” because the remaining desks are badly located, noisy, inaccessible, or unsuitable for their tasks.
The best immediate actions are usually operational:
Map the weekly profile: Identify when demand rises and falls by floor and service.
Fix booking behaviour: Remove stale reservations and make room release simple.
Rebalance zones: Convert persistently unsuitable areas rather than shrinking the floor.
Protect peak capacity: Retain contingency space for visitors, projects, and team events.
Set review ownership: Give one FM lead responsibility for turning data into actions.
How Integrated Facilities Management Supports Higher Utilisation
Variable attendance makes fragmented service contracts harder to manage. If the security provider sees one occupancy pattern, the cleaning contractor works from another rota, and reception follows a third schedule, no one owns the complete operating picture. Small gaps appear first, then tenants notice inconsistent standards, slow responses, or weak visibility at the moments that matter.
An integrated FM model brings security, cleaning, reception, and concierge activity under one accountable arrangement. The advantage isn't administrative neatness alone. A single service lead can coordinate staffing against the same attendance profile, escalate issues across functions, and adjust the daily plan without forcing the client to manage several separate suppliers.
What coordinated service looks like on the ground
On a busy midweek morning, reception can prepare for visitor arrivals and accreditation checks, security can focus on entrances and lift lobbies, and cleaning teams can prioritise high-use washrooms, meeting rooms, and communal points. Later, the service plan can move attention towards departures, waste collection, evening cleaning, and secure lock-up.
On a quiet day, the building still needs professional coverage. The difference is that teams can concentrate routine activity where people are present, while maintaining access control, patrols, incident logging, CCTV escalation, and essential hygiene. This is a controlled adjustment, not a withdrawal of service.
A fragmented model often fails in the handovers. Reception may know that a visitor is expected, but the guard on the desk may not have the same information. Cleaning may reset a room that remains booked, while facilities management lacks a reliable record of what happened. Integrated reporting gives the contract manager a clearer line of sight across these interactions.
Solomon's Facilities Management provides a London-based example of this single-supplier approach, combining security, reception, concierge, office cleaning, janitorial support, CCTV monitoring, patrols, visitor management, and related services under one contract. Its stated operating model includes SIA-licensed security personnel, dedicated site teams, 24/7 availability, digital patrol reports, incident logs, and support across Central, East, and North London.
Test whether your FM model supports utilisation
Ask practical questions:
Does one accountable manager own the daily service plan?
Can occupancy or attendance information influence cleaning and security deployment?
Do reception, security, and cleaning teams share escalation procedures?
Can you see incidents, patrols, visitor activity, and service completion in one reporting rhythm?
Can the provider maintain essential coverage while scaling routine activity appropriately?
Higher office space utilization depends on people finding a clean, secure, well-managed workplace when they attend. The service model has to reflect that reality.
The London Market Reality and What It Means for Your Strategy
A healthy utilisation figure doesn't prove that a London building is competitive. Knight Frank reported 23.9 million sq ft of London availability in Q3 2025, 28.4% above the long-term average, with overall vacancy at 9.0% compared with a 7.5% long-term average (London Office Market Report). CBRE also reported UK 12-month rolling take-up of 20.3 million sq ft in Q2 2025, the highest since Q3 2022, while H1 2025 take-up still edged down year on year.
Those signals point to a split market. Occupier demand is concentrating into newer or refurbished stock, while older, lower-spec space remains more difficult to let. An occupied building can still be underperforming if tenants tolerate poor reception, weak security visibility, inconsistent cleaning, or an unconvincing arrival experience.
Landlords and FM providers should therefore interpret utilisation alongside retention, tenant feedback, visitor experience, incidents, comfort, and the condition of shared areas. Service quality isn't decoration. In a selective market, it helps determine whether an occupier sees a building as worth returning to, renewing, or recommending.
For a wider view of how provider choice affects building operations, consider facilities management companies in the UK. The strategic question is no longer how much office space is occupied. It's which buildings are being upgraded, which are being abandoned, and which operational standards will keep occupied space competitive.
Solomon's Facilities Management coordinates security, reception, concierge, cleaning, janitorial, CCTV, patrol, and visitor management services for London workplaces through a single accountable contract. If your attendance pattern is creating midweek pressure and quiet-day waste, visit Solomon's Facilities Management to discuss a service model aligned with how your building is used.

Comments